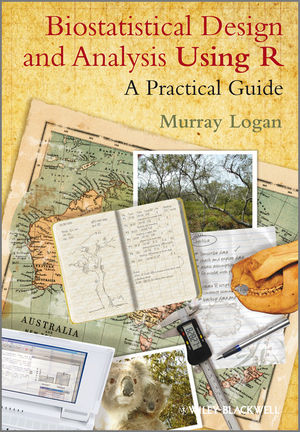
Biostatistical Design and Analysis Using R: A Practical GuideISBN: 978-1-4051-9008-4
Paperback
576 pages
May 2010, Wiley-Blackwell
 This is a Print-on-Demand title. It will be printed specifically to fill your order. Please allow an additional 10-15 days delivery time. The book is not returnable.
|
||||||
R quick reference card.
General key to statistical methods.
1 Introduction to R.
1.1 Why R?
1.2 Installing R.
1.3 The R environment.
1.4 Object names.
1.5 Expressions, Assignment and Arithmetic.
1.6 R Sessions and workspaces.
1.7 Getting help.
1.8 Functions.
1.9 Precedence.
1.10 Vectors - variables.
1.11 Matrices, lists and data frames.
1.12 Object information and conversion.
1.13 Indexing vectors, matrices and lists.
1.14 Pattern matching and replacement (character search and replace).
1.15 Data manipulation.
1.16 Functions that perform other functions repeatedly.
1.17 Programming in R.
1.18 An introduction to the R graphical environment.
1.19 Packages.
1.20 Working with scripts.
1.21 Citing R in publications.
1.22 Further reading.
2 Datasets.
2.1 Constructing data frames.
2.2 Reviewing a data frame - fix().
2.3 Importing (reading) data.
2.4 Exporting (writing) data.
2.5 Saving and loading of R objects.
2.6 Data frame vectors.
2.7 Manipulating data sets.
2.8 Dummy data sets - generating random data.
3 Introductory statistical principles.
3.1 Distributions.
3.2 Scale transformations.
3.3 Measures of location.
3.4 Measures of dispersion and variability.
3.5 Measures of the precision of estimates - standard errors and confidence intervals.
3.6 Degrees of freedom.
3.7 Methods of estimation.
3.8 Outliers.
3.9 Further reading.
4 Sampling and experimental design with R.
4.1 Random sampling.
4.2 Experimental design.
5 Graphical data presentation.
5.1 The plot() function.
5.2 Graphical Parameters.
5.3 Enhancing and customizing plots with low-level plotting functions.
5.4 Interactive graphics.
5.5 Exporting graphics.
5.6 Working with multiple graphical devices.
5.7 High-level plotting functions for univariate (single variable) data.
5.8 Presenting relationships.
5.9 Presenting grouped data.
5.10 Presenting categorical data.
5.11 Trellis graphics.
6 Simple hypothesis testing – one and two population tests.
6.1 Hypothesis testing.
6.2 One- and two-tailed tests.
6.3 t-tests.
6.4 Assumptions.
6.5 Statistical decision and power.
6.6 Robust tests.
6.7 Further reading.
6.8 Key for simple hypothesis testing.
6.9 Worked examples of real biological data sets.
7 Introduction to Linear models.
7.1 Linear models.
7.2 Linear models in R.
7.3 Estimating linear model parameters.
7.4 Comments about the importance of understanding the structure and parameterization of linear models.
8 Correlation and simple linear regression.
8.1 Correlation.
8.2 Simple linear regression.
8.3 Smoothers and local regression.
8.4 Correlation and regression in R.
8.5 Further reading.
8.6 Key for correlation and regression.
8.7 Worked examples of real biological data sets.
9 Multiple and curvilinear regression.
9.1 Multiple linear regression.
9.2 Linear models.
9.3 Null hypotheses.
9.4 Assumptions.
9.5 Curvilinear models.
9.6 Robust regression.
9.7 Model selection.
9.8 Regression trees.
9.9 Further reading.
9.10 Key and analysis sequence for multiple and complex regression.
9.11 Worked examples of real biological data sets.
10 Single factor classification (ANOVA).
10.0.1 Fixed versus random factors.
10.1 Null hypotheses.
10.2 Linear model.
10.3 Analysis of variance.
10.4 Assumptions.
10.5 Robust classification (ANOVA).
10.6 Tests of trends and means comparisons.
10.7 Power and sample size determination.
10.8 ANOVA in R.
10.9 Further reading.
10.10 Key for single factor classification (ANOVA).
10.11 Worked examples of real biological data sets.
11 Nested ANOVA.
11.1 Linear models.
11.2 Null hypotheses.
11.3 Analysis of variance.
11.4 Variance components.
11.5 Assumptions.
11.6 Pooling denominator terms.
11.7 Unbalanced nested designs.
11.8 Linear mixed effects models.
11.9 Robust alternatives.
11.10 Power and optimisation of resource allocation.
11.11 Nested ANOVA in R.
11.12 Further reading.
11.13 Key for nested ANOVA.
11.14 Worked examples of real biological data sets.
12 Factorial ANOVA.
12.1 Linear models.
12.2 Null hypotheses.
12.3 Analysis of variance.
12.4 Assumptions.
12.5 Planned and unplanned comparisons.
12.6 Unbalanced designs.
12.7 Robust factorial ANOVA.
12.8 Power and sample sizes.
12.9 Factorial ANOVA in R.
12.10 Further reading.
12.11 Key for factorial ANOVA.
12.12 Worked examples of real biological data sets.
13 Unreplicated factorial designs – randomized block and simple repeated measures.
13.1 Linear models.
13.2 Null hypotheses.
13.3 Analysis of variance.
13.4 Assumptions.
13.5 Specific comparisons.
13.6 Unbalanced un-replicated factorial designs.
13.7 Robust alternatives.
13.8 Power and blocking efficiency.
13.9 Unreplicated factorial ANOVA in R.
13.10 Further reading.
13.11 Key for randomized block and simple repeated measures ANOVA.
13.12 Worked examples of real biological data sets.
14 Partly nested designs: split plot and complex repeated measures.
14.1 Null hypotheses.
14.2 Linear models.
14.3 Analysis of variance.
14.4 Assumptions.
14.5 Other issues.
14.6 Further reading.
14.7 Key for partly nested ANOVA.
14.8 Worked examples of real biological data sets.
15 Analysis of covariance (ANCOVA).
15.1 Null hypotheses.
15.2 Linear models.
15.3 Analysis of variance.
15.4 Assumptions.
15.5 Robust ANCOVA.
15.6 Specific comparisons.
15.7 Further reading.
15.8 Key for ANCOVA.
15.9 Worked examples of real biological data sets.
16 Simple Frequency Analysis.
16.1 The chi-square statistic.
16.2 Goodness of fit tests.
16.3 Contingency tables.
16.4 G-tests.
16.5 Small sample sizes.
16.6 Alternatives.
16.7 Power analysis.
16.8 Simple frequency analysis in R.
16.9 Further reading.
16.10 Key for Analysing frequencies.
16.11 Worked examples of real biological data sets.
17 Generalized linear models (GLM).
17.1 Dispersion (over or under).
17.2 Binary data - logistic (logit) regression.
17.3 Count data - Poisson generalized linear models.
17.4 Assumptions.
17.5 Generalized additive models (GAM's) - non-parametric GLM.
17.6 GLM and R.
17.7 Further reading.
17.8 Key for GLM.
17.9 Worked examples of real biological data sets.
Bibliography.
R index.
Statistics index.
Companion website for this book: wiley.com/go/logan/r


