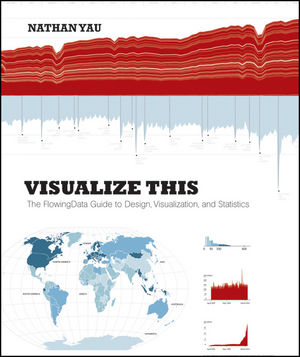
Visualize This: The FlowingData Guide to Design, Visualization, and StatisticsISBN: 978-0-470-94488-2
Paperback
384 pages
July 2011
 |
||||||
Connect with Wiley Publicity
Data is ever-increasing and can be overwhelming to organize in a way that makes sense to its audience. To mean anything, it must be presented in a way that enables people to interpret, analyze, and apply the information, and one of the best ways to do that is visually. The New York Times, for example, designs data graphics that allows readers to see what the data has to say and explore the data themselves. Now, Nathan Yau, a pioneer of this innovative approach, has written Visualize This: The FlowingData Guide to Design, Visualization and Statistics (Wiley; $39.99; July 2011; ISBN: 9780470944882) to offer readers dozens of ideas for telling a story with their own data presented in creative, visual ways.
With this full-color book, step-by-step tutorials are used to show readers how to visualize and tell stories with data. The author explains how to gather, parse, and format data and then design high quality graphics that help readers explore and present patterns, differences, and relationships. Beginning with a description of the huge growth of data and visualization in industry, news, and government the book reveals opportunities for those who tell stories with data. Visualize This then moves on to actual human stories and trends in data and statistics. The technical part is covered with how to format data with code and readily available applications, and details tools to create data graphics for print and the Web like R, Illustrator, JavaScript, Flash/Actionscript, PHP, CSS, and HTML. Readers will learn how to:
- Present data with visual representations that allow the audience to see the unexpected
- Find the stories data can tell
- Explore different data sources and determine effective formats for presentation
- Experiment with and compare different visualization tools
- Look for trends and patterns in data and select appropriate ways to chart them
- Establish clear goals to guide visualizations
Complete with a companion web site at www.wiley.com/go/visualizethis, it provides code samples, data files, and interactive examples to reveal how visualization works. Visualize This demonstrates how to explain data visually so that readers can present information in a way that is easy to understand and is appealing to viewers. Inside the book, professionals will discover an almost endless variety of ways to give data new dimensions.
About the Author
Nathan Yau is a PhD candidate in Statistics at UCLA and a lifelong data junkie. His goal is to make data available and useful to those who aren't necessarily data experts, and he focuses on data visualization and personal data collection. You can follow his visualization experiments at http://flowingdata.com.
About Wiley
Founded in 1807, John Wiley & Sons, Inc. has been a valued source of information and understanding for more than 200 years, helping people around the world meet their needs and fulfill their aspirations. Wiley and its acquired companies have published the works of more than 450 Nobel laureates in all categories: Literature, Economics, Physiology or Medicine, Physics, Chemistry, and Peace.
Our core businesses publish scientific, technical, medical, and scholarly journals, encyclopedias, books, and online products and services; professional/trade books, subscription products, training materials, and online applications and Web sites; and educational materials for undergraduate and graduate students and lifelong learners. Wiley's global headquarters are located in Hoboken, New Jersey, with operations in the U.S., Europe, Asia, Canada, and Australia. The Company's Web site can be accessed at http://www.wiley.com. The Company is listed on the New York Stock Exchange under the symbols JWa and JWb.


