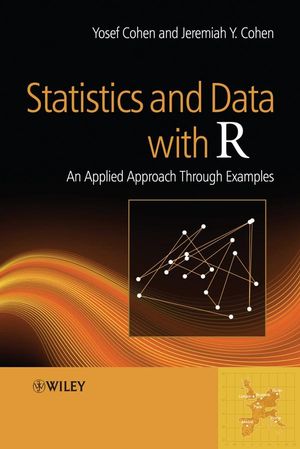
Statistics and Data with R: An Applied Approach Through ExamplesISBN: 978-0-470-75805-2
Hardcover
618 pages
December 2008
 This is a Print-on-Demand title. It will be printed specifically to fill your order. Please allow an additional 15-20 days delivery time. The book is not returnable.
|
||||||
Part I: Data in statistics and R.
1. Basic R.
1.1 Preliminaries.
1.2 Modes.
1.3 Vectors.
1.4 Arithmetic operators and special values.
1.5 Objects.
1.6 Programming.
1.7 Packages.
1.8 Graphics.
1.9 Customizing the workspace.
1.10 Projects.
1.12 Assignments.
2. Data in statistics and in R.
2.1 Types of data.
2.2 Objects that hold data.
2.3 Data organization.
2.4 Data import, export and connections.
2.5 Data manipulation.
2.6 Manipulating strings.
2.7 Assignments.
3. Presenting data.
3.1 Tables and the flavors of apply ()
3.2 Bar plots.
3.3 Histograms.
3.4 Dot charts.
3.5 Scatter plots.
3.6 Lattice plots.
3.7 Three-dimensional plots and contours.
3.8 Assignments.
Part II: Probability, densities and distributions.
4. Probability and random variables.
4.1 Set theory.
4.2 Trials, events and experiments.
4.3 Definitions and properties of probability.
4.4 Conditional probability and independence.
4.5 Algebra with probabilities.
4.6 Random variables.
4.7 Assignments.
5. Discrete densities and distributions.
5.1 Densities.
5.2 Distribution.
5.3 Properties.
5.4 Expected values.
5.5 Variance and standard deviation.
5.6 The binomial.
5.7 The Poisson.
5.8 Estimating parameters.
5.9 Some useful discrete densities.
5.10 Assignments.
6. Continuous distributions and densities.
6.1 Distributions.
6.2 Densities.
6.3 Properties.
6.4 Expected values.
6.5 Variance and standard deviation.
6.6 Areas under density curves.
6.7 Inverse distributions and simulations.
6.8 Some useful continuous densities.
6.9 Assignments.
7. The normal and sampling densities.
7.1 The normal density.
7.2 Applications of the normal.
7.3 Data transformations.
7.4 Random samples and sampling densities.
7.5 A detour: using R efficiently.
7.6 The sampling density of the mean.
7.7 The sampling density of proportion.
7.8 The sampling density of intensity.
7.9 The sampling density of variance.
7.10 Bootstrap: arbitrary parameters of arbitrary densities.
7.11 Assignments.
Part III: Statistics.
8. Exploratory data analysis.
8.1 Graphical methods.
8.2 Numerical summaries.
8.3 Visual summaries.
8.4 Assignments.
9. Point and interval estimation.
9.1 Point estimation.
9.2 Interval estimation.
9.3 Point and interval estimation for arbitrary densities.
9.4 Assignments.
10. Single sample hypotheses testing.
10.1 Null and alternative hypotheses.
10.2 Large sample hypothesis testing.
10.3 Small sample hypotheses testing.
10.4 Arbitrary parameters of arbitrary densities.
10.5 p-values.
10.6 Assignments.
11. Power and sample size for single samples.
11.1 Large sample.
11.2 Small samples.
11.3 Power and sample size for arbitrary densities.
11.4 Assignments.
12. Two samples.
12.1 Large samples.
12.2 Small samples.
12.3 Unknown densities.
12.4 Assignments.
13. Power and sample size for two samples.
13.1 Two means from normal populations.
13.2 Two proportions.
13.3 Two rates.
13.4 Assignments.
14. Simple linear regression.
14.1 Simple linear models.
14.2 Estimating regression coefficients.
14.3 The model goodness of fit.
14.4 Hypothesis testing and confidence intervals.
14.5 Model assumptions.
14.6 Model diagnostics.
14.7 Power and sample size for the correlation coefficient.
14.8 Assignments.
15. Analysis of variance.
15.1 One-way, fixed-effects ANOVA.
15.2 Non-parametric one-way ANOVA.
15.3 One-way, random-effects ANOVA.
15.4 Two-way ANOVA.
15.5 Two-way linear mixed effects models.
15.6 Assignments.
16. Simple logistic regression.
16.1 Simple binomial logistic regression.
16.2 Fitting and selecting models.
16.3 Assessing goodness of fit.
16.4 Diagnostics.
16.5 Assignments.
17. Application: the shape of wars to come.
17.1 A statistical profile of the war in Iraq.
17.2 A statistical profile of the second Intifada.
References.
R Index.
General Index.


