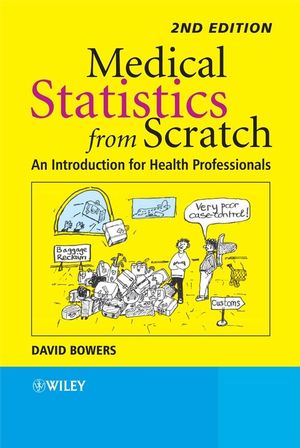
Medical Statistics from Scratch: An Introduction for Health Professionals, 2nd EditionISBN: 978-0-470-51301-9
Paperback
300 pages
March 2008
 This title is out-of-print and not currently available for purchase from this site.
|
Preface to the 2nd Edition.
Introduction.
I Some fundamental stuff.
1 First things first – the nature of data.
Learning objectives.
Variables and data.
The good, the bad and the ugly - types of variable.
Categorical variables.
Metric variables.
II Descriptive statistics.
2 Describing data with tables.
Learning objectives.
What is descriptive statistics?
The frequency table.
3 Describing data with charts.
Learning objectives Picture it!
Charting nominal and ordinal data Charting discrete metric data.
Charting continuous metric data.
Charting cumulative data.
4 Describing data from its distributional shape Learning objectives.
The shape of things to come.
5 Describing data with numeric summary values.
Learning objectives.
Numbers R us.
Summary measures of location.
Summary measures of spread.
Standard deviation and the Normal distribution.
III Getting the data.
6 Doing it right first time – designing a study Learning objectives.
Hey ho! Hey ho! It's off to work we go.
Collecting the data - types of sample Types of study.
Confounding.
Matching.
Comparing cohort and case-control designs.
Getting stuck in - experimental studies.
IV From little to large – statistical inference.
7 From samples to populations – making inferences.
Learning objectives.
Statistical inference.
8 Probability, risk and odds
Learning objectives.
Chance would be a fine thing - the idea of probability.
Calculating probability.
Probability and the Normal distribution.
Risk.
Odds.
Why you can't calculate risk in a case-control study.
The link between probability and odds.
The risk ratio.
The odds ratio.
Number needed to treat .
V The informed guess - confidence interval estimation.
9 Estimating the value of a single population parameter - the idea of confidence intervals.
Learning objectives.
Confidence interval estimation for a population mean.
Confidence interval for a population proportion.
Estimating a confidence interval for the median of a single population.
10 Estimating the differences between two population parameters.
Learning objectives.
What's the difference?
Estimating the difference between the means of two independent populations – using a method based on the two-sample t test.
Estimating the difference between two matched population means – using a method based on the matched-pairs t test.
Estimating the difference between two independent population proportions.
Estimating the difference between two independent population medians – the Mann–Whitney rank-sums method.
Estimating the difference between two matched population medians - Wilcoxon signed-ranks method.
11 Estimating the ratio of two population parameters.
Learning objectives.
Estimating ratios of means, risks and odds.
VI Putting it to the test.
12 Testing hypotheses about the difference between two population parameters.
Learning objectives.
The research question and the hypothesis test.
A brief summary of a few of the commonest tests.
Some examples of hypothesis tests from practice.
Confidence intervals versus hypothesis testing.
Nobody's perfect - types of error.
The power of a test.
Maximising power - calculating sample size.
Rules of thumb.
13 Testing hypotheses about the ratio of two population parameters.
Learning objectives.
Testing the risk ratio.
Testing the odds ratio.
14 Testing hypotheses about the equality of two or more proportions.
Learning objectives.
Of all the tests in all the world...the chi-squared (χ2) test.
VII Getting up close.
15 Measuring the association between two variables.
Learning objectives.
Association.
The correlation coefficient.
16 Measuring the agreement between two variables.
Learning objectives.
To agree or not agree: that is the question.
Cohen's kappa.
Measuring agreement with ordinal data - weighted kappa.
Measuring the agreement between two metric continuous variables.
VIII Getting into a relationship.
17 Straight-line models - linear regression.
Learning objectives.
Health warning!
Relationship and association.
The linear regression model.
Model building and variable selection.
18 Curvy models - logistic regression.
Learning objectives.
A second health warning!
The logistic regression model.
IX Two more chapters.
19 Measuring survival.
Learning objectives.
Introduction.
Calculating survival probabilities and the proportion surviving: the Kaplan-Meier table.
The Kaplan–Meier chart.
Determining median survival time.
Comparing survival with two groups.
20 Systematic review and meta-analysis.
Learning objectives.
Introduction.
Systematic review.
Publication and other biases.
The funnel plot.
Combining the studies.
Appendix: Table of random numbers.
Solutions to Exercises.
References.
Index.


